By Henry Kinyua
After my recent analysis of the performance of Murang’a, Nyeri and Kiambu counties at the Nairobi Coffee Exchange (NCE) in the ongoing 2025/2026 season up to Sale 29, one request came up repeatedly: “How does Nyeri compare with Kirinyaga?”
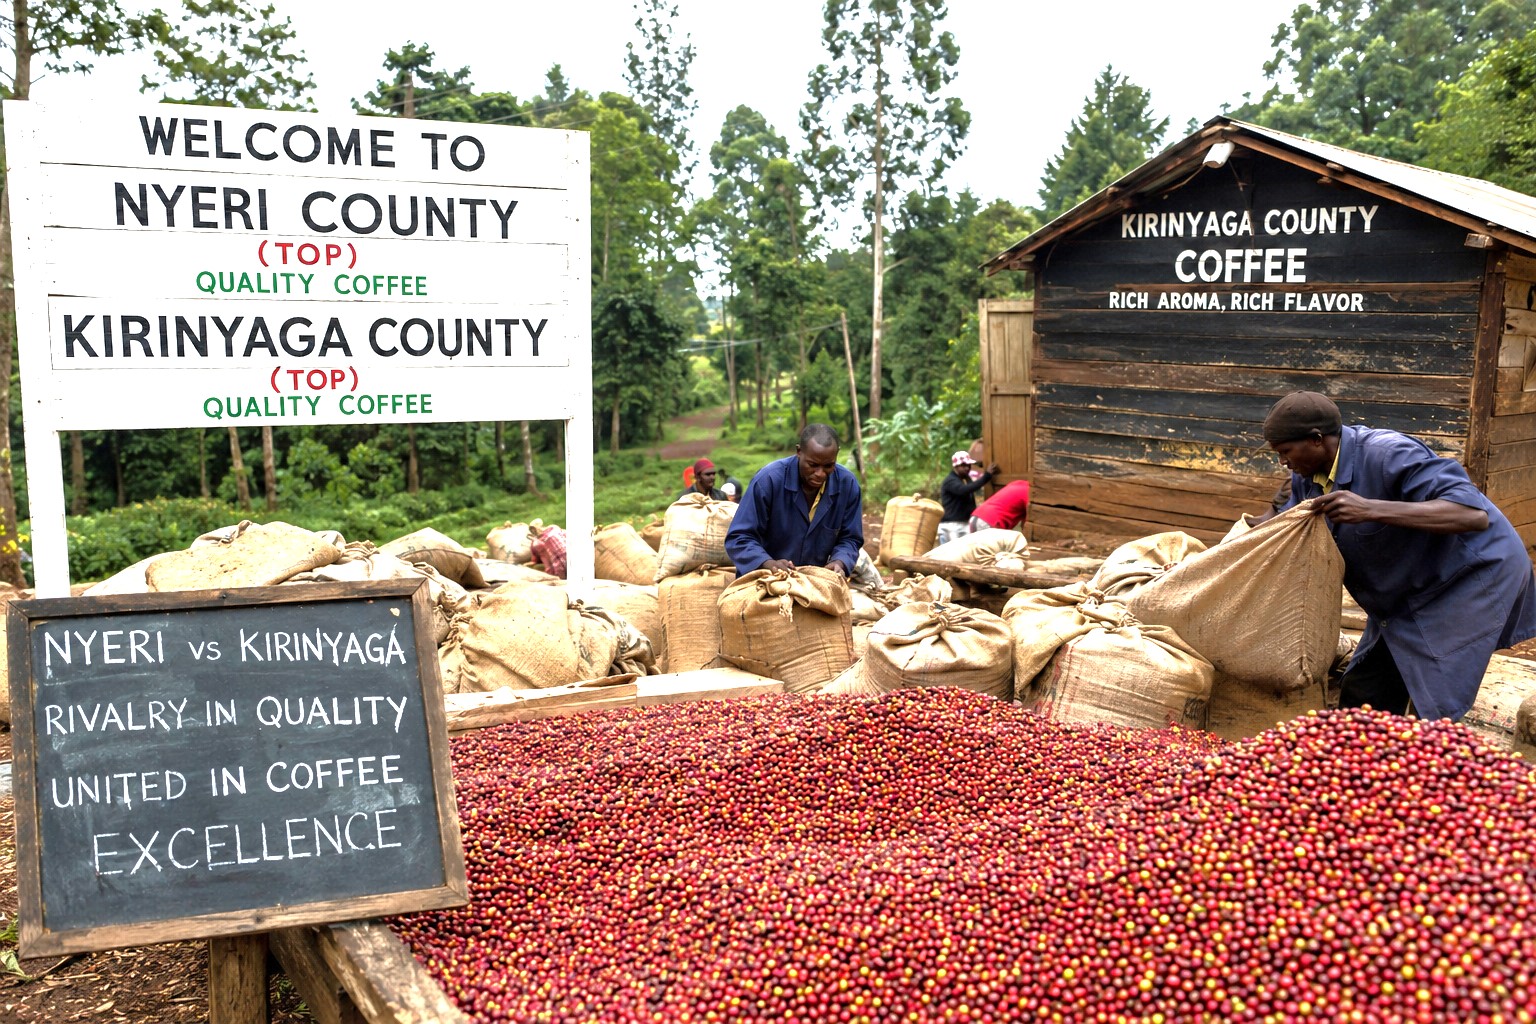
And understandably so. Few rivalries in Kenya’s coffee sector are as interesting as the one between Nyeri and Kirinyaga. The two neighbouring counties produce some of Kenya’s finest coffees, compete for the same buyers, and, perhaps most importantly, share farmers in the border areas who sometimes deliver coffee to whichever cooperative appears more organized or offers better services.
At the moment, Nyeri appears to be winning the mid-season volume battle while Kirinyaga holds the value title. By Sale 29 of the current 2025/2026 season, Nyeri had traded 4.08 million kilograms of coffee, at an average price of 352 USD per 50kg bag, compared to Kirinyaga’s 3.39 million kilograms at an average price of 378 USD per 50kg bag. For many Nyeri coffee farmers, this has triggered renewed optimism that the county may finally be reclaiming its traditional dominance.
But the story between these two coffee giants cannot be told by looking at one season alone. A look at historical trends over the last decade paints a very different picture.
Back in the 2013/2014 season, Nyeri was clearly ahead, marketing 9.16 million kilograms, significantly higher than Kirinyaga’s 5.61 million kilograms. Nyeri remained ahead again in 2014/2015, trading 5.66 million kilograms against Kirinyaga’s 4.64 million kilograms.
Then came a major turning point. In the 2015/2016 season, Kirinyaga volume surged, marketing 6.18 million kilograms compared to Nyeri’s 7.52 million. Wait, Nyeri still led that season. But by 2016/2017, the tables had clearly turned. Kirinyaga marketed 5.41 million kilograms, while Nyeri dropped sharply to 4.09 million kilograms.
From that point onward, Kirinyaga never looked back.

Season after season, Kirinyaga consistently outperformed Nyeri in marketed volumes. In 2017/2018, Kirinyaga sold 6.20 million kilograms compared to Nyeri’s 5.03 million kilograms. The gap widened in 2018/2019, and even during the challenging years around 2020/2021, Kirinyaga remained ahead. The biggest statement came in 2023/2024, when Kirinyaga marketed an impressive 8.93 million kilograms, while Nyeri managed 6.52 million kilograms.
One explanation often given for Kirinyaga’s rise is the strength and consistency of its cooperative movement. Kirinyaga cooperatives are frequently praised for stronger farmer mobilization, faster decision-making, better aggregation systems and a more aggressive approach to governance. The county has also benefited from highly active farmer-owned institutions, a county union, a brokerage Firm, and marketing agencies.
Nyeri, on the other hand, has traditionally enjoyed a strong reputation for quality and cup profile, producing some of Kenya’s most sought-after coffees. Yet, despite premium prices, the county has sometimes struggled with volume consistency, factory governance challenges and fragmentation in cooperative performance.
That is why the current mid-season numbers are attracting attention.
Could Nyeri’s 4.08 million kilograms already traded by Sale 29 signal a comeback? Is the county slowly reclaiming lost ground against its neighbour? Or will Kirinyaga once again overtake Nyeri once the season closes, especially considering that some coffee is still expected to come into the market?
For coffee farmers, this is more than statistics; it is county pride, cooperative confidence and, ultimately, farmer incomes. So, let the rivalry continue!
If you are a coffee farmer from Kirinyaga, what is it you do better than in Nyeri? And if you are from Nyeri, are the current mid-season results a sign that the county is reclaiming its crown